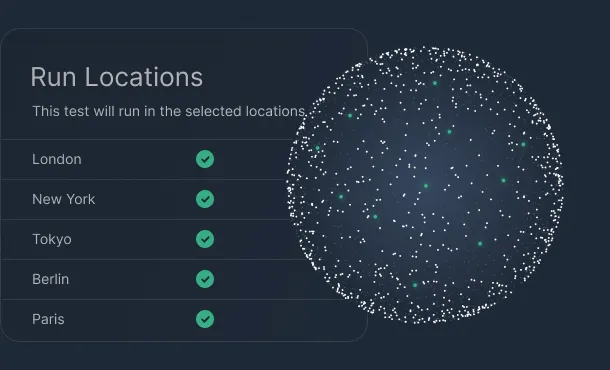
Free Uptime Checker
Website uptime is the percentage of time your website or service is accessible and responding correctly to requests. It's typically expressed as a percentage — for example, 99.9% uptime means your site was unavailable for roughly 8.7 hours over the course of a full year. For businesses, uptime is a direct measure of reliability and has a tangible impact on revenue, customer trust, and search engine rankings.
An uptime check sends an HTTP or HTTPS request to your website or API endpoint and measures whether it receives a valid response. It records the HTTP status code returned (e.g. 200 OK, 500 Internal Server Error), the response time in milliseconds, and whether the connection was established at all. A successful check confirms your server is reachable and responding — a failed check indicates downtime or degraded performance.
Slow response times in an uptime check can be caused by several factors: server overload or insufficient resources, unoptimised database queries, lack of caching, large uncompressed assets, geographic distance between the test location and your server, or a slow DNS resolution time. Network congestion and shared hosting environments can also introduce latency spikes that show up as slow uptime readings even if your site appears fine to local users.
A response time under 200ms is considered excellent. Between 200ms and 500ms is acceptable for most applications. Anything over 1 second starts to affect user experience and can negatively impact conversion rates. Google's Core Web Vitals guidelines recommend that a server responds within 800ms (Time to First Byte) for pages to be considered fast. If your uptime check consistently returns times above 1–2 seconds, it's worth investigating your hosting infrastructure or caching setup.
A free uptime check like this one gives you a real-time snapshot — it tells you if your site is up right now, from one location, at this moment. Uptime monitoring, by contrast, checks your site continuously from multiple global locations every 30 seconds to 5 minutes, and alerts you immediately when something goes wrong. A one-off check is useful for diagnosing an issue; continuous monitoring is what protects you from outages going undetected for hours.
Search engines like Google crawl your site regularly. If Googlebot visits during a period of downtime and receives a 5xx error, it may temporarily de-index your pages. Repeated or extended downtime signals unreliability to crawlers, which can lead to lower crawl frequency and reduced rankings over time. Maintaining high uptime (99.9% or above) ensures your pages remain indexed, accessible, and competitive in search results.

Keep your site available around the clock with checks from multiple global locations every 60 seconds. Get instant alerts by email, Slack, or webhooks the moment downtime is detected so you can fix issues before users notice.
Learn more
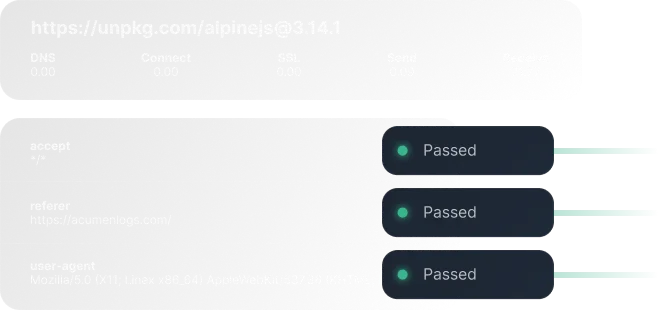
Simulate real user journeys in the browser to catch broken flows, JavaScript errors, and slow pages before they impact revenue. Build and maintain journeys without code, validate key steps like logins and checkouts with screenshots, and videos when something fails.
Learn more
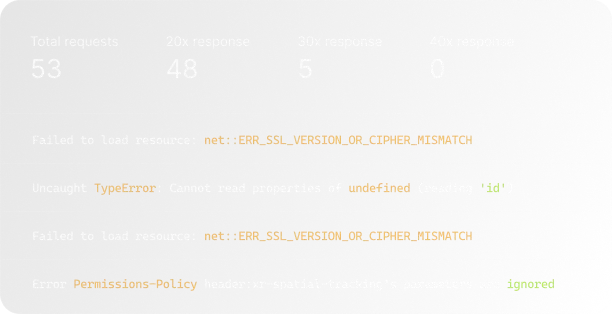
Track mission‑critical flows such as signup, checkout, and dashboards end‑to‑end, not just single pages. Acumen Logs surfaces failed network requests, console errors, and regressions in real time so your team can resolve UX issues quickly.
Learn more

Add lightweight heartbeat checks to scheduled jobs and background workers so you know when something silently stops running. Get alerted on missed or late heartbeats, and review a history of successful runs to prove reliability to stakeholders.
Learn more
Automatically watch your SSL certificates and domains for expiry so you never lose traffic or trust to a preventable error. Receive proactive reminders and status checks that help you stay compliant, secure, and interruption‑free.
Learn more
Continuously test your REST and GraphQL endpoints for uptime, latency, and response correctness from regions that match your users. Validate status codes, schemas, and payloads, and trigger alerts when responses slow down or no longer match expectations.
Learn more