Trusted by Top-tier product companies


Synthetic testing is like having a friendly robot test your website 24/7. It clicks links, logs in, and adds things to a shopping cart just like a real human would. Because it's constantly checking things from all over the world, it catches broken buttons or slow pages before your actual customers do. Real-life example: Imagine it’s 3:00 AM and your "Buy Now" button randomly breaks. A synthetic test catches it instantly and alerts you, so you can fix it before your morning rush of shoppers ever notices.
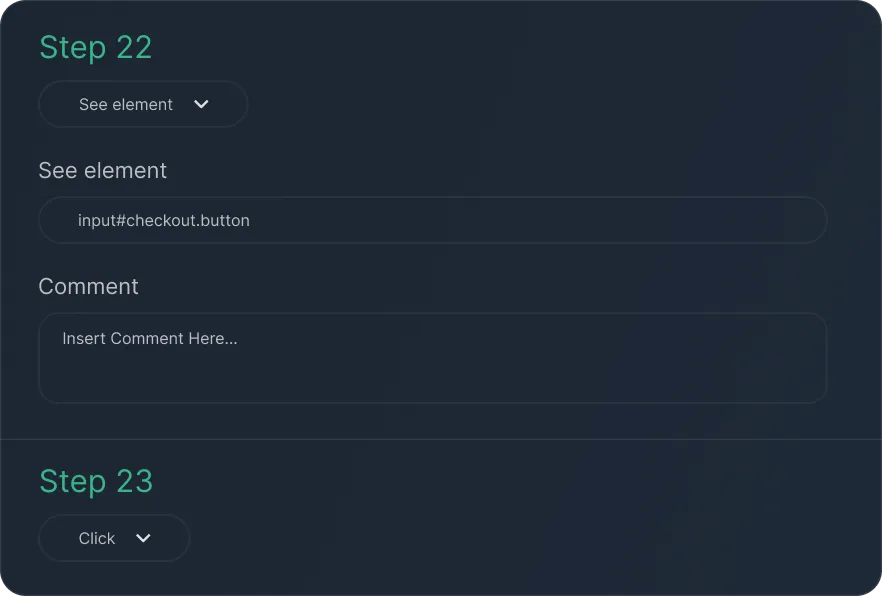
Learn moreBuild detailed user journey monitoring flows to simulate real interactions in minutes. You can customize steps, set conditions, and add validation points to replicate exactly how people use your application. Creating no-code synthetic tests has never been easier.
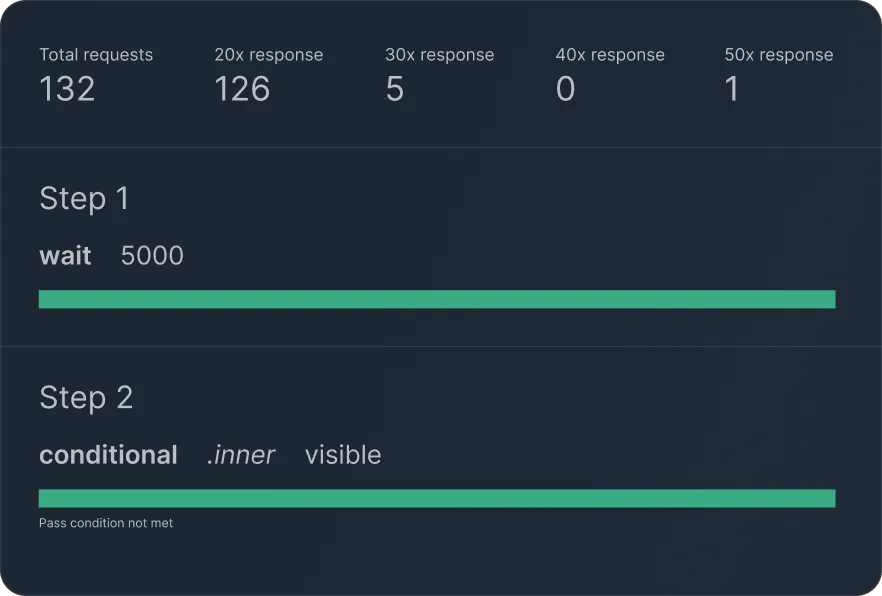
Track your end-to-end monitoring results from a single dynamic dashboard. You can view execution status, performance metrics, HTTP request logs, and console messages all in one place.
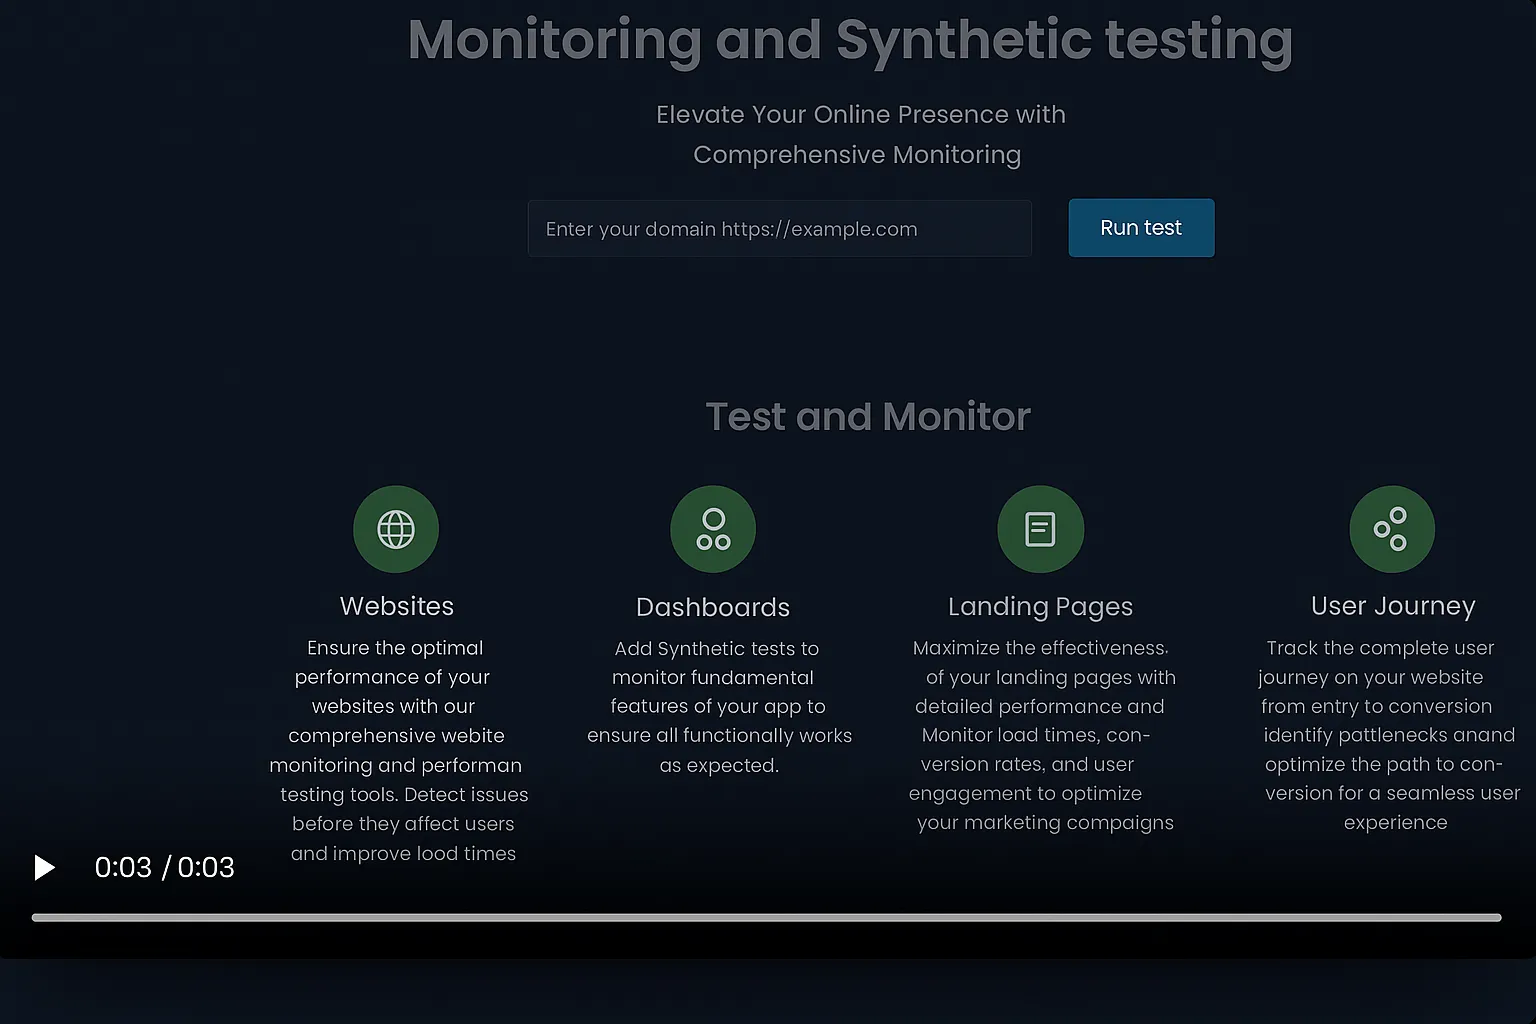
See exactly what went wrong during your tests. We capture full screenshots and video recordings of every synthetic test batch. This helps you spot visual bugs and load delays just as your users would experience them.
Protect your test environments with strict domain whitelisting and IP blacklisting. We ensure your synthetic tests only interact with trusted domains and alerting you if any domains are requested outside of that. Avoid PolyShell attacks and retain your users trust.
Test email-triggered flows from start to finish. Every monitor includes a dedicated test inbox. Your journeys can easily receive sign-up confirmations, password resets, and critical notifications to verify they actually arrive.
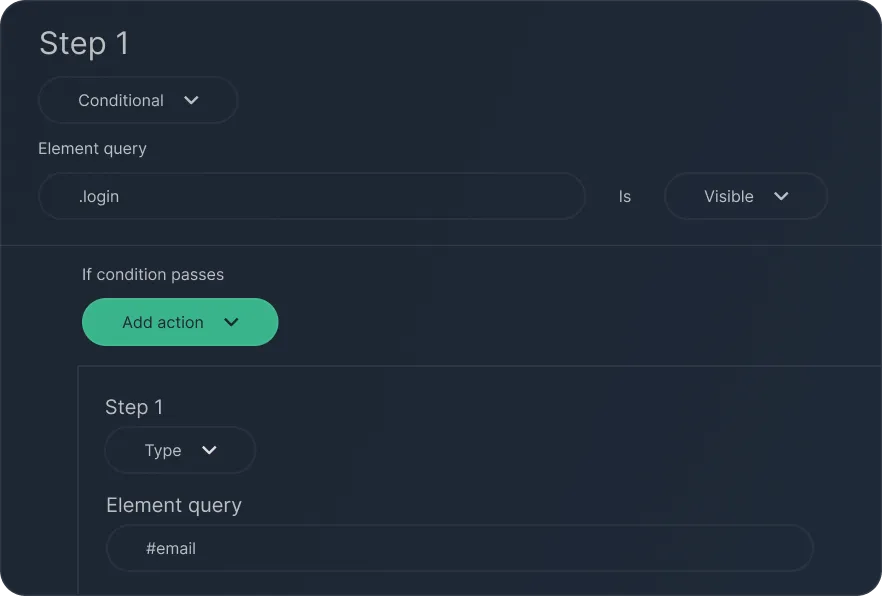
Build smart synthetic tests that adapt to different scenarios. You can configure conditional journeys based on element visibility to accurately simulate complex user interactions and branching paths.
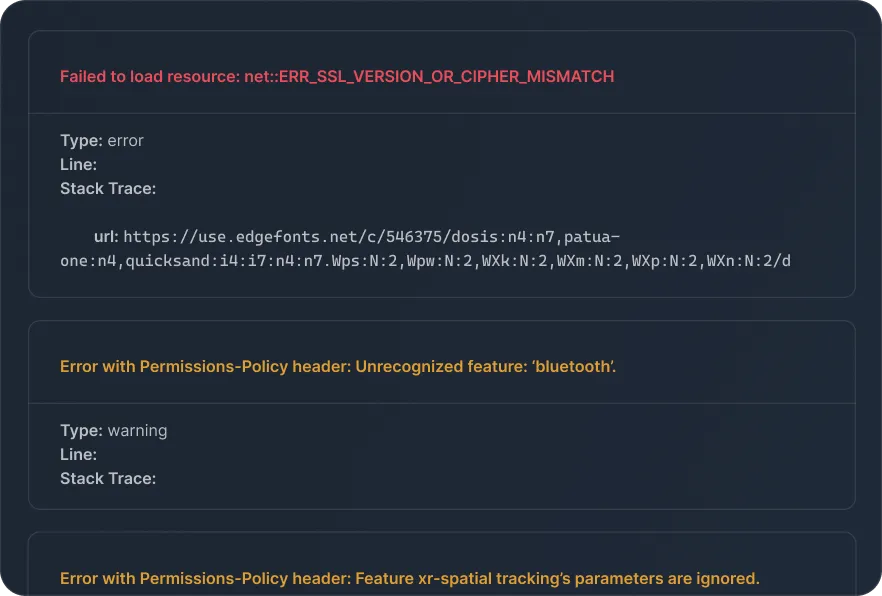
Make debugging simple with deep console logs and AI-driven analysis. You can pinpoint precise errors and find their exact origins inside the console, speeding up your resolution time for performance and functional issues.
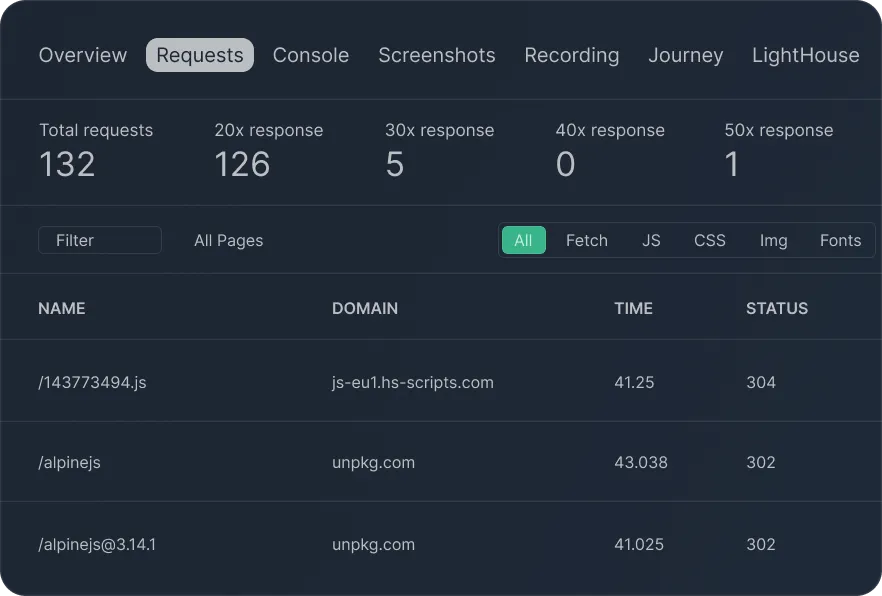
Filter your test requests quickly by content type or HTTP status. Whether you need to inspect CSS, JavaScript, images, or fonts, you can focus on the most important metrics and avoid information overload.
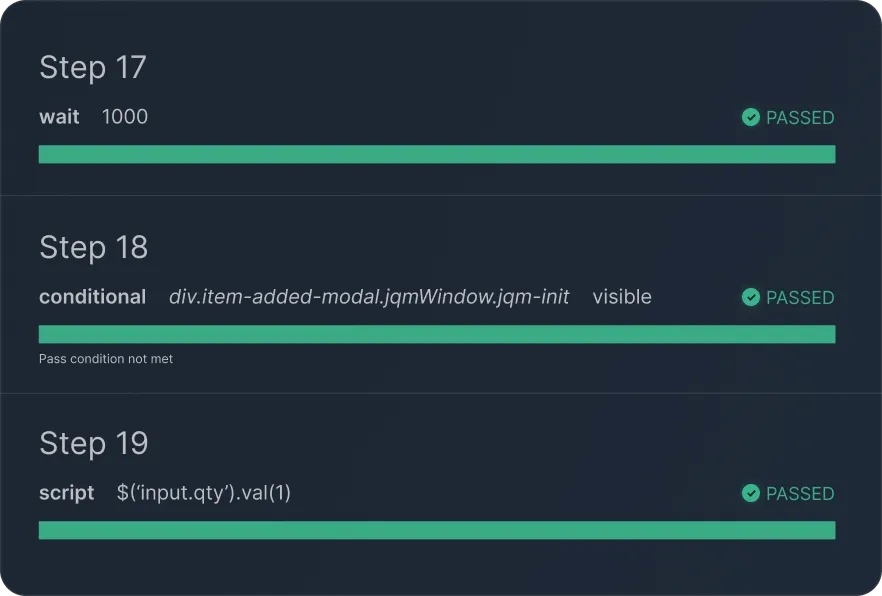
Track login monitoring and checkout monitoring flows with step-by-step success and failure insights. We pair these insights with direct visual evidence so you can identify critical issues before they impact your buyers.
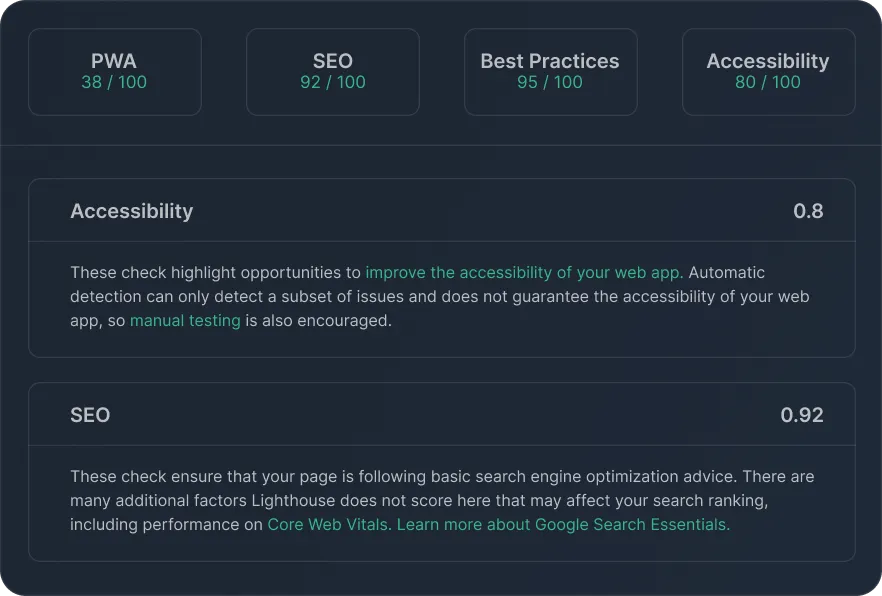
Bring Google Lighthouse metrics directly into your synthetic monitoring reports. You gain valuable SEO-relevant insights into page performance, accessibility, and best practices alongside your standard browser monitoring.

Keep your site available around the clock with checks from multiple global locations every 60 seconds. Get instant alerts by email, Slack, or webhooks the moment downtime is detected so you can fix issues before users notice.
Learn more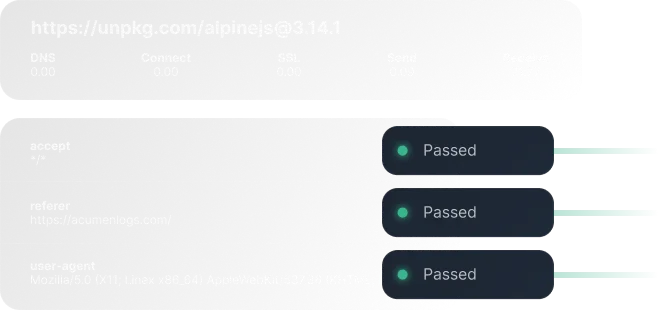
Simulate real user journeys in the browser to catch broken flows, JavaScript errors, and slow pages before they impact revenue. Build and maintain journeys without code, validate key steps like logins and checkouts with screenshots, and videos when something fails.
Learn more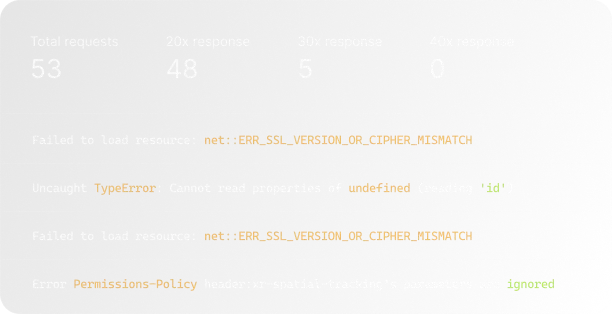
Track mission‑critical flows such as signup, checkout, and dashboards end‑to‑end, not just single pages. Acumen Logs surfaces failed network requests, console errors, and regressions in real time so your team can resolve UX issues quickly.
Learn more