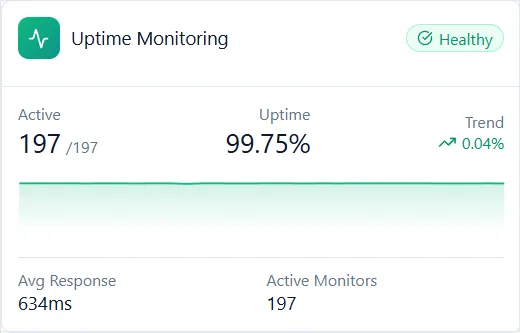
Trusted by Top-tier product companies



Configulre your monitors and alerts, then relax. We will notify you when things go down.
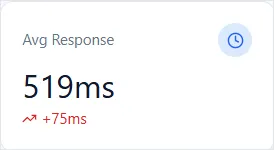
Don't let workers and scheduled tasks silently fail. It takes 30 seconds to create a heartbeat monitor and ensure that all your background tasks are working as expected.
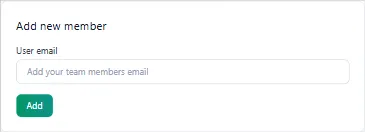
We have a simple but powerful permissions model allowing you to bring the whole team on-board, and protect your stack.
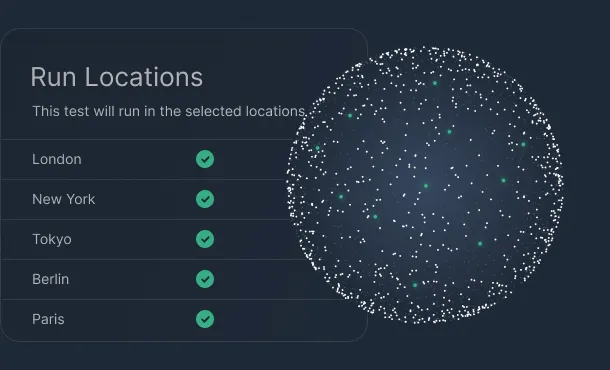
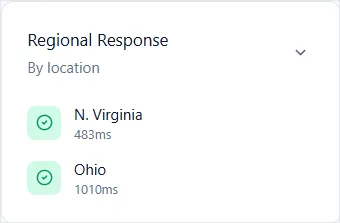
Keep your site available around the clock with checks from multiple global locations every 60 seconds. Get instant alerts by email, Slack, or webhooks the moment downtime is detected so you can fix issues before users notice.
Learn more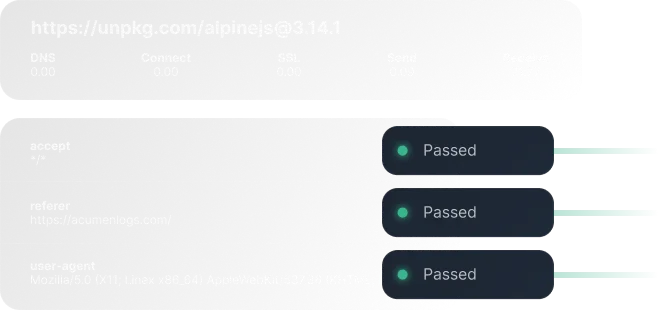
Simulate real user journeys in the browser to catch broken flows, JavaScript errors, and slow pages before they impact revenue. Build and maintain journeys without code, validate key steps like logins and checkouts with screenshots, and videos when something fails.
Learn more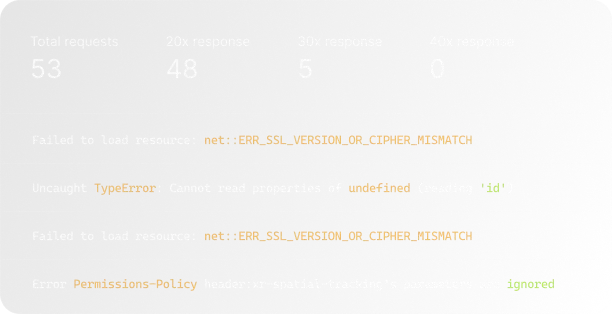
Track mission‑critical flows such as signup, checkout, and dashboards end‑to‑end, not just single pages. Acumen Logs surfaces failed network requests, console errors, and regressions in real time so your team can resolve UX issues quickly.
Learn more