Create a new revenue stream by reseling monitoring

Resell Uptime and Synthetic Monitoring, set your own markup and improve your customer retention
Verified check mark
30+ monitors for free
Verified check mark
AI test generation
Verified check mark
Real-time alerts
Verified check mark
Public status pages
Acumen Logs Uptime dashboard screenshotAcumen Logs Synthetic dashboard screenshotAcumen Logs SSL dashboard screenshotAcumen Logs API dashboard screenshot

Trusted by Top-tier product companies

PrismRBS customer logo
Monitor Your Websites
Get detailed insights, screenshots, logs and videos to catch and fix issues fast.

SLL, RDAP, RUM - We Have It
Easily monitor uptime, user journey’s, APIs, and more. Our AI integration and clean UI help you get set up fast!
Get Alerts and Insights
Get notified via Slack, Teams, SMS, Webhooks and much more. All our notifications are real time - no delays.

Trusted by Top-tier product companies

Resell Uptime

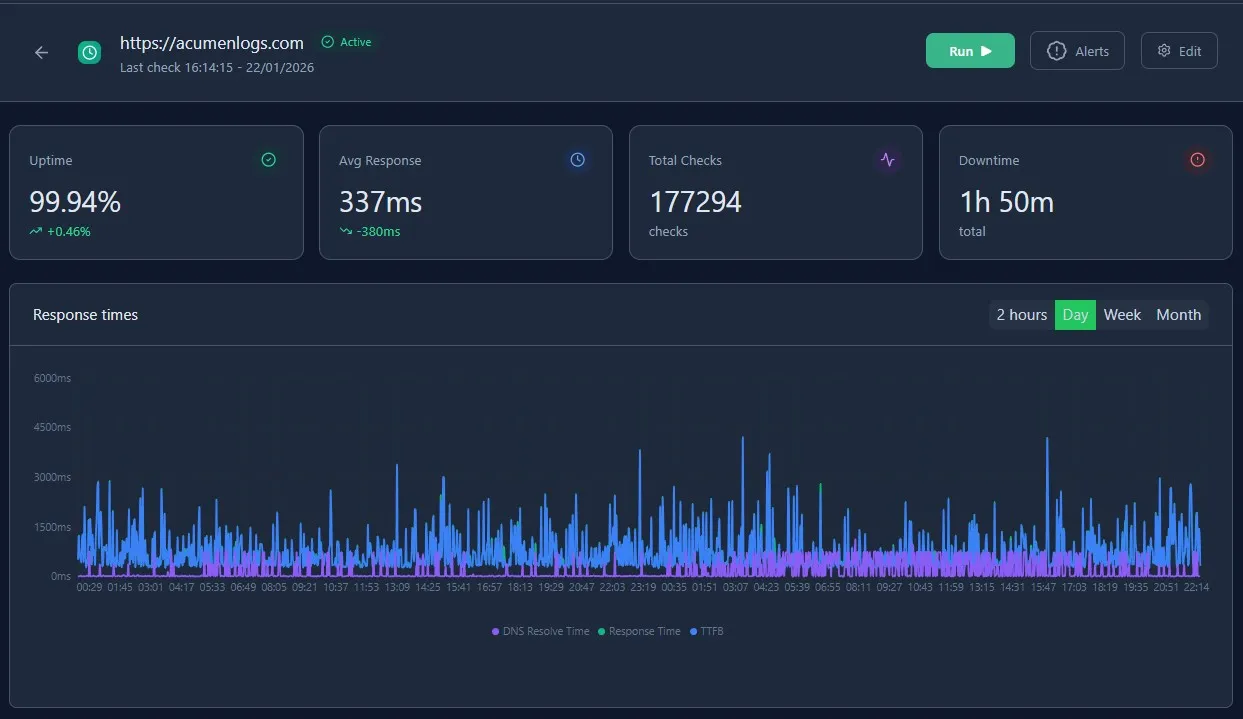
Provide reliable website uptime monitoring to your clients with real-time checks, instant downtime alerts, and performance insights, all managed directly inside WHMCS.

Your customers stay protected from outages, while you gain a scalable recurring revenue service that strengthens trust and reduces support tickets.
WHMCS logo
Whitelabel everything

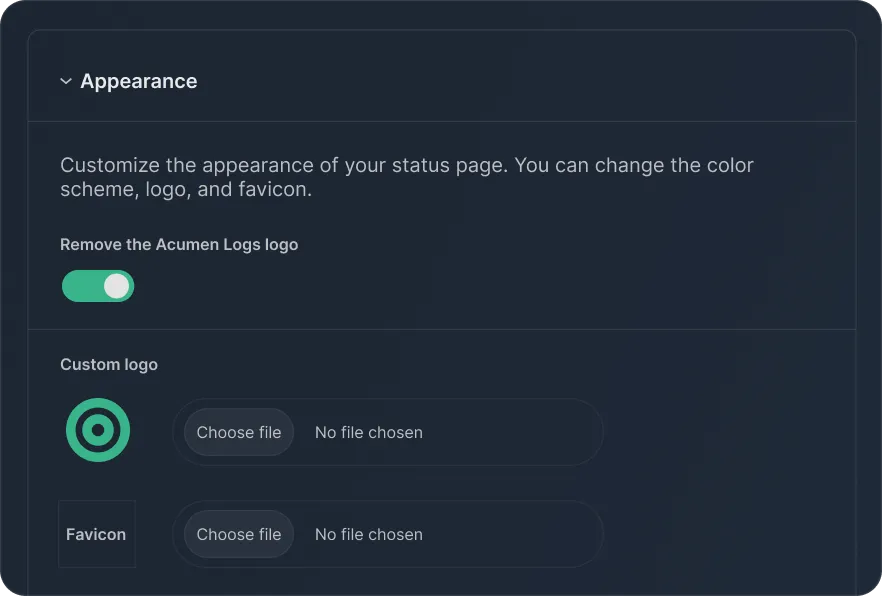
Offer monitoring services under your own brand with full white-label control across the entire platform. Use your logo, colors, domain, and custom email templates to create a seamless experience for your clients.

From dashboards to alerts and reports, every touchpoint reflects your business, helping you build trust, retain customers, and grow recurring revenue through your WHMCS integration.
Branded status page preview
Simple WHMCS installation

Install the AcumenLogs WHMCS module in minutes with a quick setup process and clear documentation. No complex configuration or custom development is required.

Connect your AcumenLogs account, configure your monitoring products, and start offering uptime and synthetic monitoring to your clients directly from WHMCS.
Acumen Logs synthetic monitoring screenshot
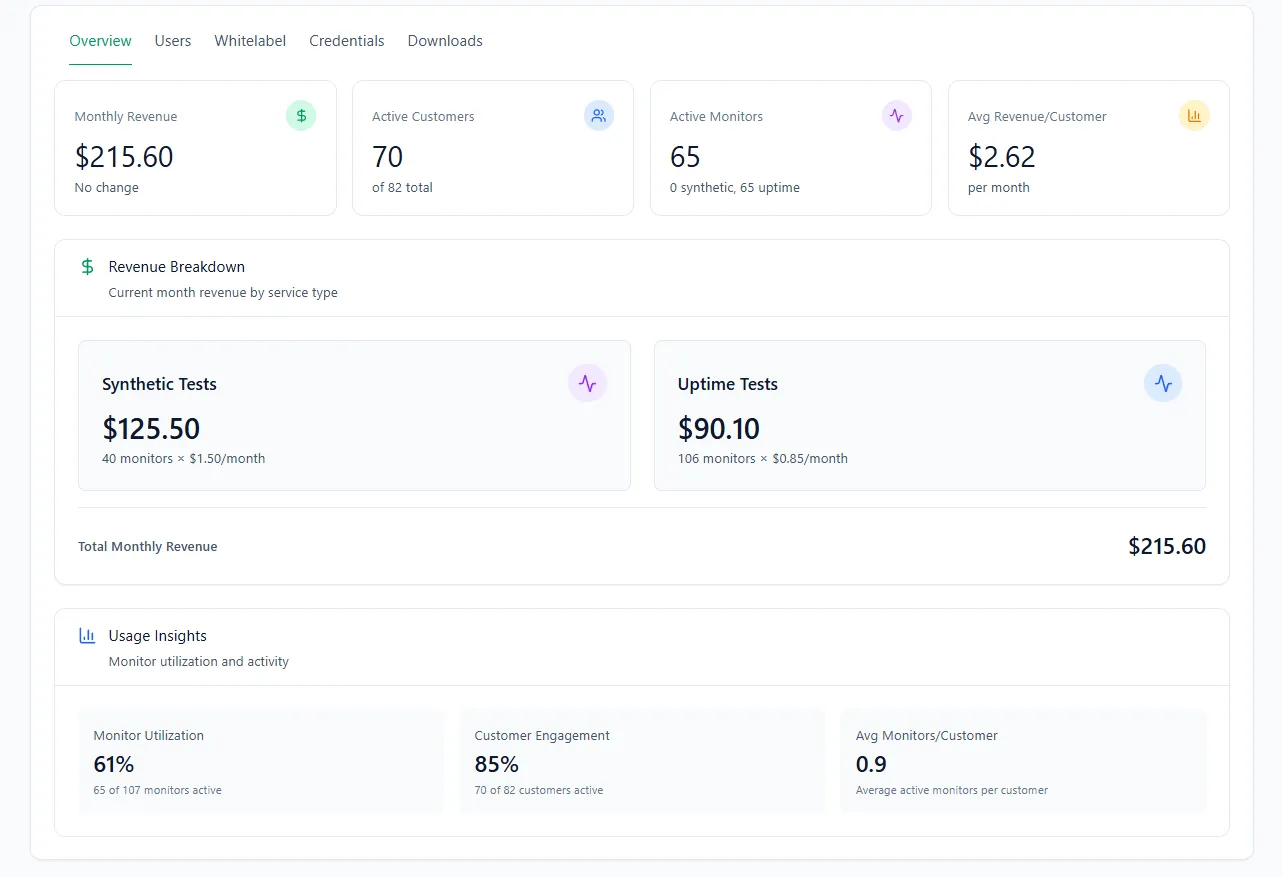
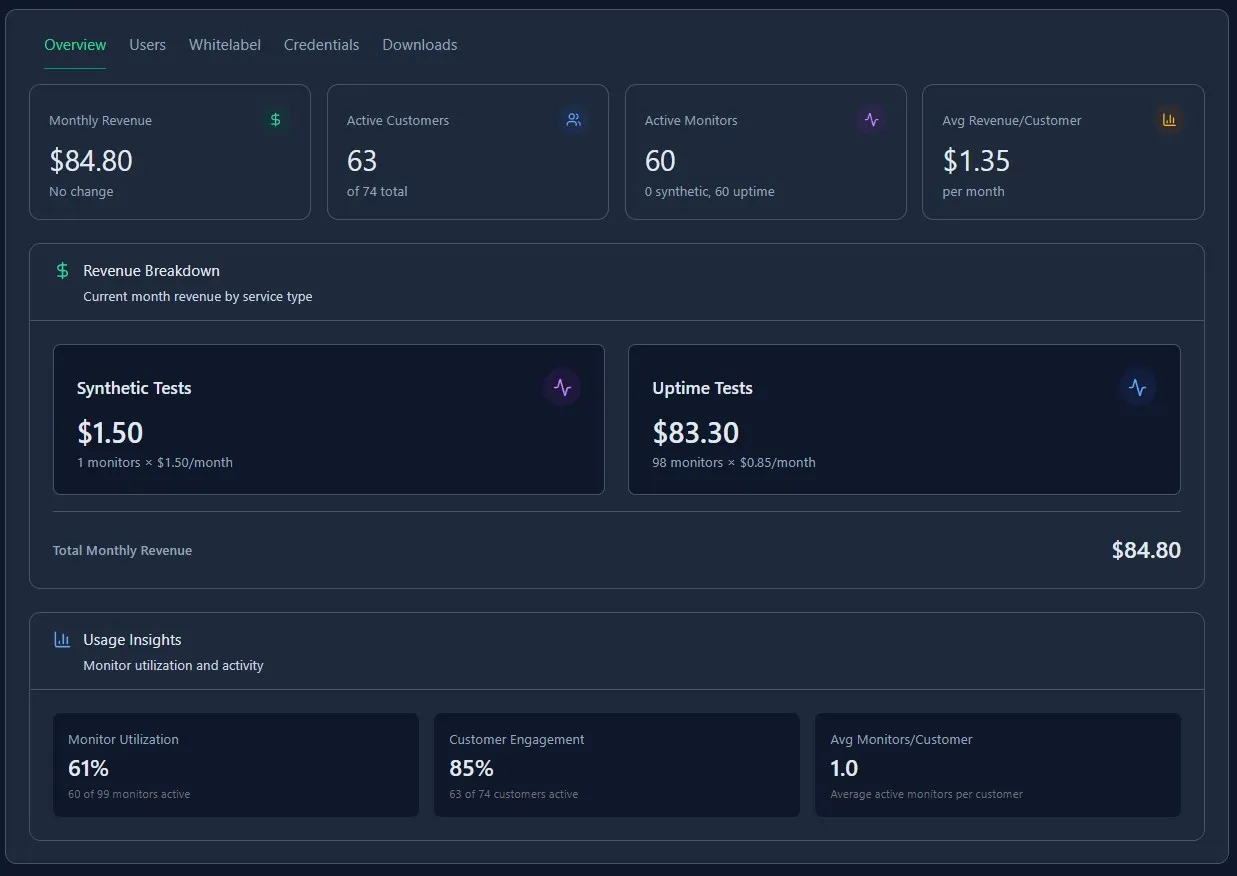
Sales dashboard

Track your monitoring sales, revenue, and active subscriptions in one central dashboard. Get clear visibility into customer usage, plan performance, and growth trends.

Use real-time insights to optimize pricing, identify upsell opportunities, and scale your monitoring services confidently through WHMCS.
Sales illustration

Explore more of our Features

Get full visibility into every layer of your product - from uptime to real user journeys.
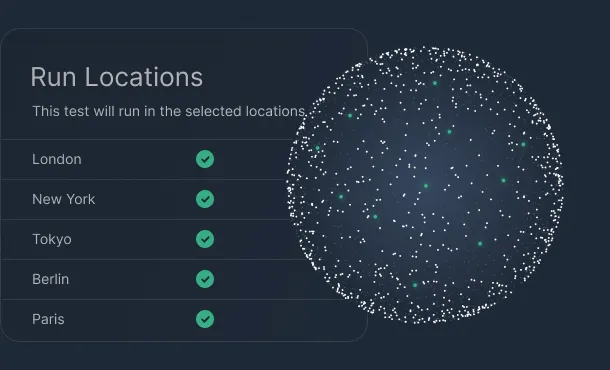
Global uptime monitoring map
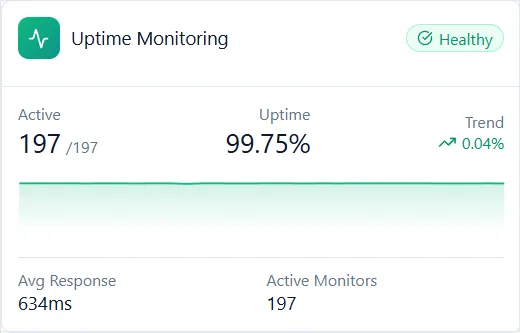
Uptime Monitoring

Keep your site available around the clock with checks from multiple global locations every 60 seconds. Get instant alerts by email, Slack, or webhooks the moment downtime is detected so you can fix issues before users notice.

Learn more
Synthetic monitoring card preview
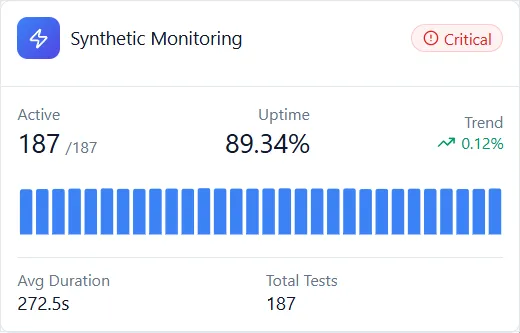
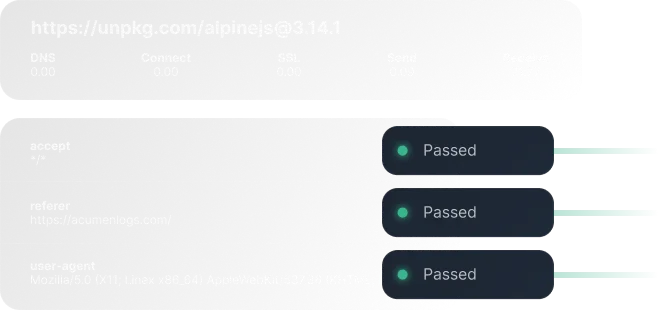
Synthetic Monitoring

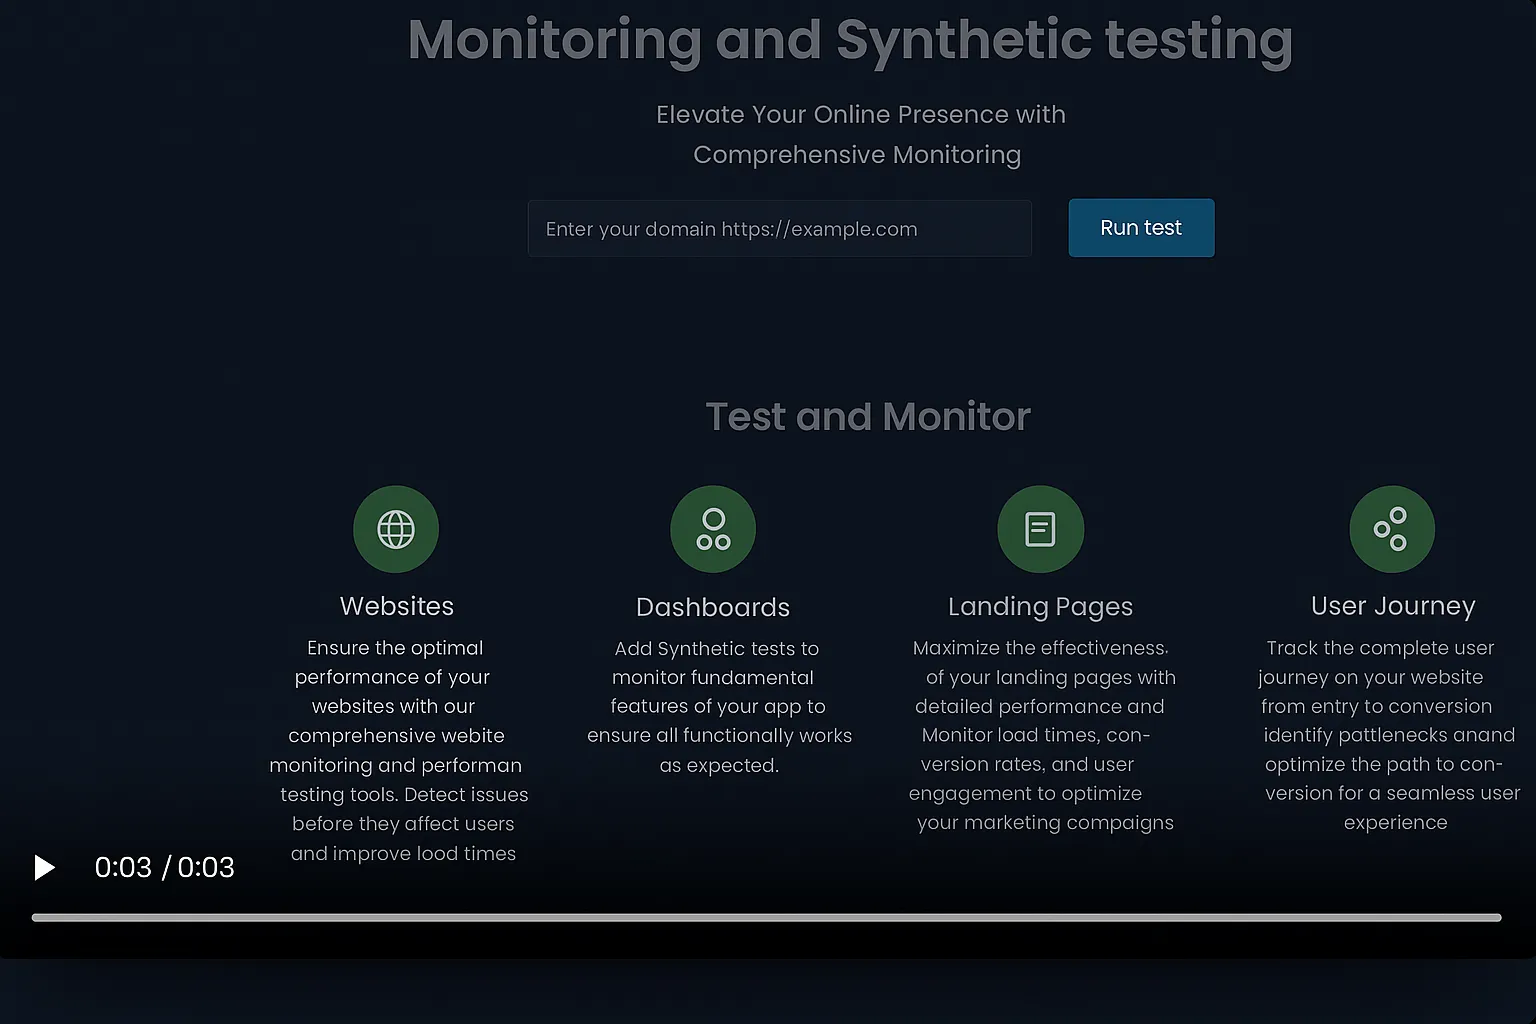
Simulate real user journeys in the browser to catch broken flows, JavaScript errors, and slow pages before they impact revenue. Build and maintain journeys without code, validate key steps like logins and checkouts with screenshots, and videos when something fails.

Learn more
User journey card preview
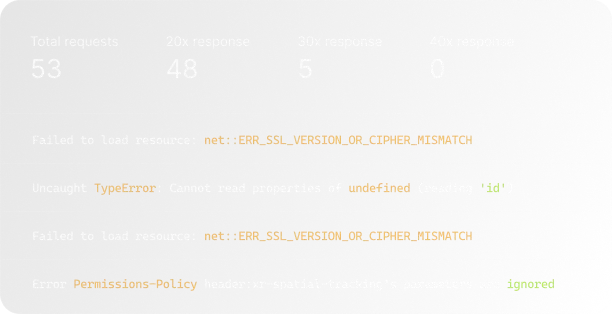
Critical User Journey Monitoring

Track mission‑critical flows such as signup, checkout, and dashboards end‑to‑end, not just single pages. Acumen Logs surfaces failed network requests, console errors, and regressions in real time so your team can resolve UX issues quickly.

Learn more

Pulse chart preview
CRON Job Monitoring

Add lightweight heartbeat checks to scheduled jobs and background workers so you know when something silently stops running. Get alerted on missed or late heartbeats, and review a history of successful runs to prove reliability to stakeholders.

Learn more
SSL monitoring card preview
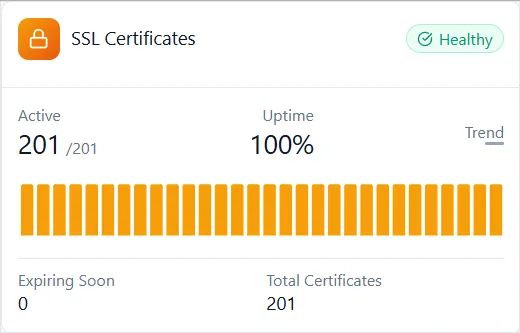
SSL Monitoring

Automatically watch your SSL certificates and domains for expiry so you never lose traffic or trust to a preventable error. Receive proactive reminders and status checks that help you stay compliant, secure, and interruption‑free.

Learn more
Health card preview
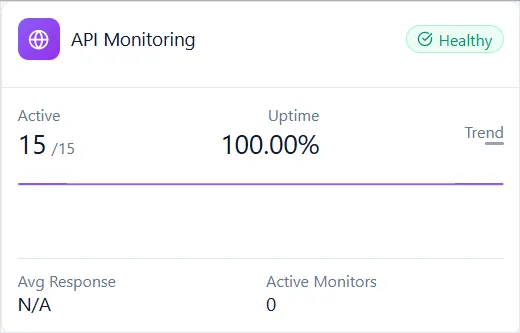
API Monitoring

Continuously test your REST and GraphQL endpoints for uptime, latency, and response correctness from regions that match your users. Validate status codes, schemas, and payloads, and trigger alerts when responses slow down or no longer match expectations.

Learn more

Frequently

Asked
Questions

WHMCS module questions answered
Up right arrow
How long does it take to install the WHMCS module?
Up arrow icon
Installation typically takes just a few minutes. The module is designed for quick setup with no coding or complex configuration required.
Can I fully white-label the monitoring platform?
Up arrow icon
Yes. You can customize branding, domain, emails, and dashboards so your clients see your company, not AcumenLogs.
How are my clients billed for monitoring?
Up arrow icon
You bill your clients directly through WHMCS. Acumen Logs bills you at wholesale rates, allowing you to set your own pricing and margins.
What types of monitoring can I resell?
Up arrow icon
You can resell uptime monitoring, SSL and WHOIS monitoring, and synthetic monitoring for end-to-end website journeys.
Do you offer a free trial?
Up arrow icon
Yes. You can start with a free trial to test the platform and WHMCS integration before offering it to your clients.