Catching JavaScript Console Errors with Synthetic Monitoring
TL;DR

Why Console Errors Are Worth Monitoring
Console errors often signal subtle but serious problems:
- A login form fails silently because a script threw a
TypeError - A third-party analytics script fails to load, affecting tracking
- A button click handler doesn’t work due to a missing dependency
- A JS module crashes only in production (but not locally)
These errors don't always trigger HTTP failures. Your uptime checks stay green. But the experience is broken.
Synthetic monitoring changes that by acting like a user, inside a browser, and surfacing everything the console sees.
What Is Synthetic Monitoring (In This Context)?
Synthetic monitoring simulates real user behavior — logging in, clicking buttons, navigating pages — using automated browser sessions (e.g. Puppeteer, Playwright, or purpose-built platforms like Acumen Logs).
And during those sessions, you can:
- Listen to console logs
- Catch errors, warnings, or custom logs
- Record and inspect them as part of your monitoring results
This lets you catch real JS problems that unit tests, uptime checks, or backend logs would completely miss.
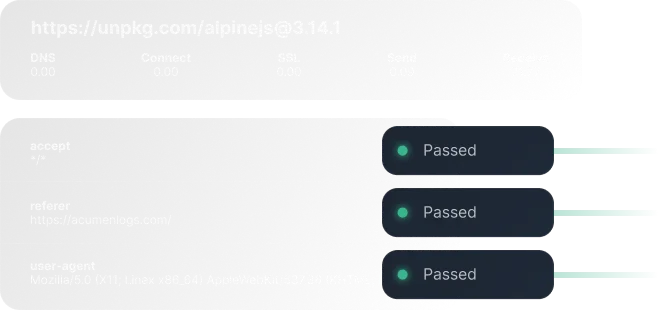
Example: Catching a Console Error Mid-Journey
Imagine this user journey:
- Go to
/login - Enter credentials
- Click submit
- Wait for redirect
- Navigate to
/dashboard
With synthetic monitoring, you can:
- Simulate the whole flow
- Capture console logs at each step
- Flag the journey as failed if
console.error()appears
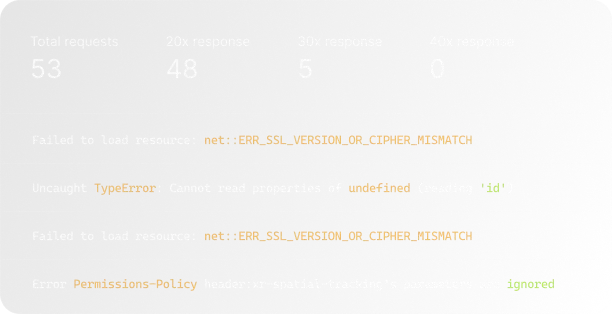
For instance, you might catch:
Uncaught TypeError: Cannot read properties of undefined (reading 'id')That’s a serious problem — and something you’d want to fix before more users hit it.
How Acumen Logs Helps You Monitor Console Errors
At Acumen Logs, we built synthetic monitoring with developers in mind. That means we capture JavaScript console logs automatically during every synthetic journey — so you can detect real errors, not just status codes.
✅ Monitor console output (error, warn, log, info)
✅ Flag failed steps when an error is thrown
✅ View full log messages in your dashboard
✅ Combine with network request analysis and screenshots
✅ Get notified via Slack, email, or webhooks the moment something breaks
It’s like having DevTools open on a robot that checks your app every few minutes — and sends you a bug report when something’s wrong.
Bonus: Catching Framework-Specific Errors
Whether you're using Vue, React, Laravel Blade with Alpine, or even old-school jQuery, console errors can originate from:
- Client-side route changes
- Component rendering bugs
- Unhandled promises
- Failing third-party SDKs (analytics, payment providers)
Monitoring the console ensures you're not just checking if the app loads, but if it’s actually working as expected under the hood.
Final Thoughts
Uptime checks can tell you if your site is reachable. But only synthetic monitoring with console log capture can tell you if it's usable.
If you're serious about frontend reliability, you need to know when console errors are happening in real user flows — and fix them before users ever notice.
With Acumen Logs, you can simulate entire browser sessions, capture errors, and close the gap between deployment and debugging.
Key Takeaways
- Hidden console exceptions routinely lock up essential user workflows while leaving your primary server infrastructure completely online.
- Automating script inspections inside real, headless browser environments allows developers to isolate localized layout issues before deploying code updates.
- Monitoring live execution environments ensures you spot third-party script crashes—like tag managers or analytics tools—before they disrupt your active conversion funnels.
Frequently Asked Questions
Can standard web uptime checks detect broken frontend JavaScript scripts?