Why Traditional Web Monitoring Is Failing DevOps Teams in 2024 (And How to Fix It)

Alert Fatigue and Noise Overload
Getting alerted when something’s wrong is great—until you’re getting pinged every other minute. Alert fatigue has become a real problem. Teams are bombarded by so many notifications that it’s hard to tell real issues from false alarms. As one analysis noted, legacy monitoring tools often “flood teams with notifications without actionable insight”, leading to “too many alerts and not enough actionable insight”splunk.com. Important signals get lost in the noise. Engineers become desensitized, or worse, start ignoring alerts altogether. This noise overload not only slows down response times but can burn out on-call developers. No one wants to sift through a haystack of trivial alerts to find the one critical needle.
Missing Context and Actionable Insights
Even when an alert is legitimate, traditional monitors often tell you something broke but not why. An uptime ping might say a site is down, but it won’t tell you what the error was or what happened right before. This lack of context forces engineers into detective mode during incidents. They have to scramble through logs, recreate user steps, or guess at possible causes. It’s no surprise that “missing context is particularly problematic because it forces IT teams to spend time investigating and troubleshooting alerts”bigpanda.io. An alert that simply says “Checkout page failed” isn’t actionable without error details or logs. Without additional insight, you’re left in the dark – the alert tells you something’s wrong but gives no clues on how to fix it. That slows down incident response and prolongs downtime.
Clunky UX and Fragmented Tooling
Another source of frustration is the user experience of legacy monitoring tools. Many dashboards feel dated, unintuitive, or sluggish. Navigating between separate systems for uptime, performance, and error tracking can feel like a chore. In fact, many teams suffer from “tool sprawl” – using one tool for basic uptime pings, another for synthetic tests, and yet another for logs or user metrics. As Splunk’s engineers describe, monitoring today often means juggling too many disjointed tools that don’t integratesplunk.com. This fragmented approach is a nightmare for UX: you have to context-switch between multiple dashboards to get a full picture of an incident. Data lives in different silos. There’s no single pane of glass to see what’s going on. Moreover, older interfaces weren’t built with today’s DevOps workflows in mind – they can be slow, with poor visualization and limited collaboration features. All of this makes using traditional monitors more cumbersome than it should be.
Struggling to Simulate Real User Behavior
Perhaps one of the biggest gaps in legacy monitoring is the difficulty of simulating real user journeys. Basic uptime monitors only check if a URL responds, but they can’t tell you if the login flow or checkout process is actually working. Advanced synthetic monitoring exists, but historically it required writing scripts or code (often Selenium or custom scripts) to mimic user actions. That’s a tall order – creating scripts that truly simulate real user interactions can be complex and time-consuming, especially for modern single-page appsloadview-testing.com. Every time your app UI changes, those scripts may break, needing constant maintenance. Many teams either skip synthetic tests or set up only a few simplistic ones, leaving huge coverage gaps. The end result is that you often don’t catch critical user-facing issues until a real user encounters them. On top of that, synthetic monitoring has a reputation for being costly at scale, with some vendors charging premium prices per test or location. Comprehensive end-to-end testing “can be expensive, especially for high-frequency or global tests”loadview-testing.com – not exactly encouraging for teams on a budget.
A Modern Solution: How Acumen Logs Eases These Pains
It’s clear that DevOps engineers in 2024-2025 need a better approach. Acumen Logs is a new monitoring platform that was built with these exact frustrations in mind. It aims to streamline web monitoring by combining tools, adding context, and focusing on developer experience. Let’s see how it tackles each of the pain points above in a practical, developer-friendly way.
Developer-Focused Monitoring. Acumen Logs takes a developer-first approach to monitoring, illustrated by the icons above: a no-code journey builder (compass), fair pricing (price tag), and dev integration for team workflows (monitor with code symbol). Unlike legacy suites, this platform was designed for modern DevOps needs – bringing multiple capabilities into one place and making them accessible without steep learning curves.
Unified Uptime + Synthetic Monitoring in One Place
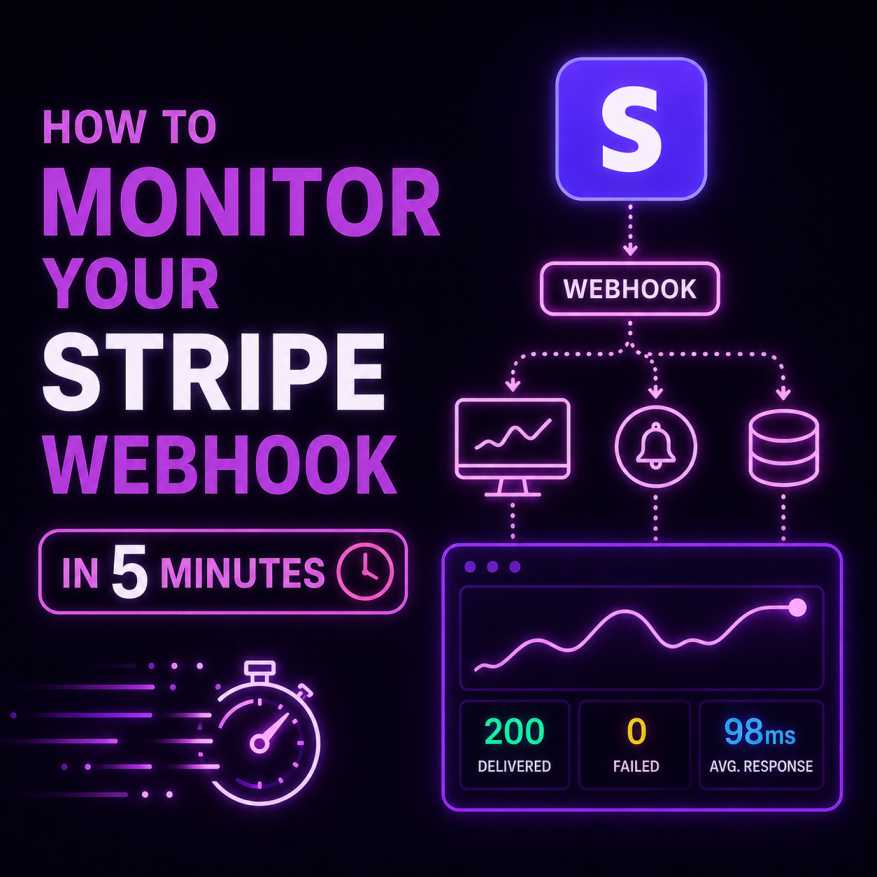
“Monitor Everything in One Place.” Acumen Logs eliminates the need for juggling multiple disconnected services by unifying uptime and synthetic testing on a single platform. In one dashboard, you can keep an eye on basic uptime pings and complex user flows. For example, the system can monitor website uptime, APIs, and critical user journeys with real-time alerts and detailed insightsacumenlogs.com – all within the same interface. This unified approach means no more hopping between an uptime tool and a separate transaction testing tool to correlate an incident. When an alert comes in, you can immediately see if it’s a global outage, a specific API failing, or a broken step in a user journey. Fewer tools also means fewer duplicate alerts. A single integrated alerting system can intelligently notify you of issues without spamming you from all sides. By consolidating monitoring, Acumen Logs cuts through the tool sprawl and noise, giving DevOps teams a clearer, central source of truth.
No-Code Journey Builder for Real User Flows
One of Acumen Logs’ standout features is its no-code Journey Builder, which makes simulating real user behavior much easier. Instead of writing brittle Selenium scripts, you can create multi-step user scenarios through a visual interface. Critical user journeys – like logging in, adding an item to cart, and checking out – can be modeled without coding. The journey builder even supports advanced logic, letting you add conditional steps and variables to mimic real-world usage patternsacumenlogs.com. This addresses the biggest challenge of synthetic monitoring: keeping tests in sync with your app. Because it’s code-free and intuitive, your team can update synthetic tests quickly whenever the app changes, without needing a QA engineer to rewrite scripts. The result is proactive testing of real user paths. You’ll catch if the login page is throwing a JavaScript error or if the checkout button vanished – before customers do. As a bonus, Acumen’s synthetic tests can be run from multiple global locations out of the box, so you can simulate user experiences from London to Sydney. The platform essentially brings what used to require three different tools (uptime pings, a scripting framework, and a geo-distributed tester) into one coherent system.
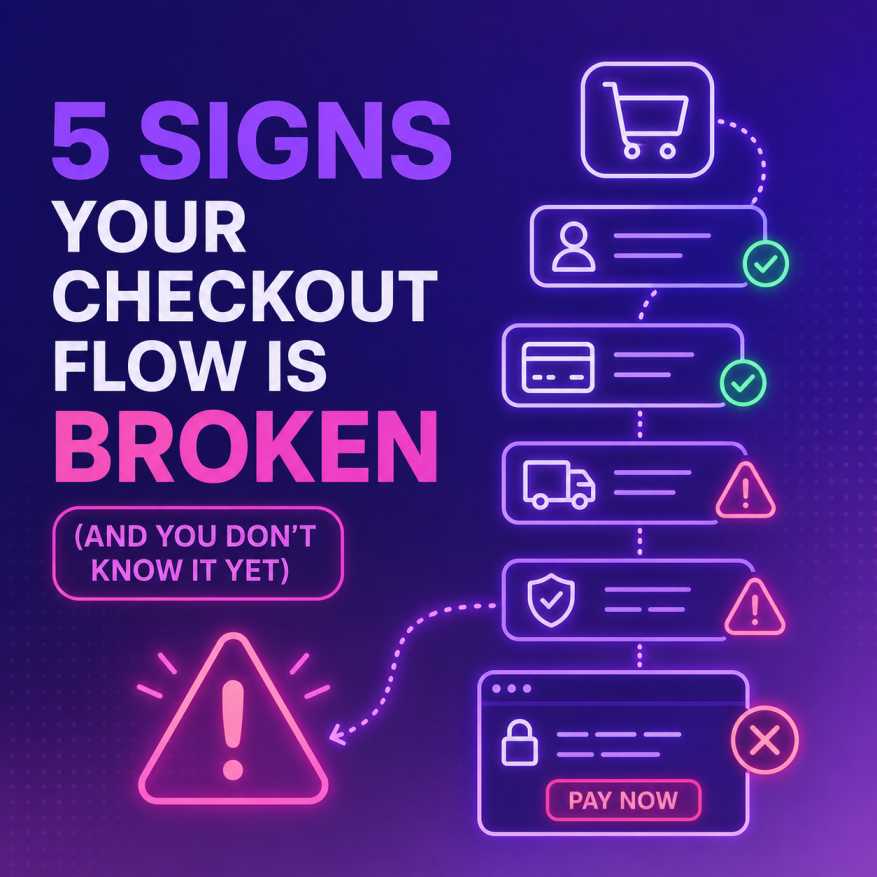
Detailed Incident Context with Logs and Screenshots
Remember those context-less alerts? Acumen Logs tackles that by providing rich context for every incident. When a synthetic journey fails or an uptime check goes down, the platform doesn’t just send a plain “it failed” message. It captures the details of what happened on the ground. This includes JavaScript console logs, network request data, HTTP statuses, and more from the browser during a synthetic test. If your signup test fails because of a JS error, you’ll see the error message and stack trace immediately. Acumen even goes a step further by providing video recordings and screenshots of synthetic test runsmarketplace.whmcs.com. Essentially, you get to replay the user journey to see exactly what went wrong – a feature that “provides clear insights without needing to interpret technical error codes”marketplace.whmcs.com. All this context means your alerts become truly actionable. Instead of “something broke,” an alert might tell you “Checkout flow failed at Step 3: Missing element – ‘Pay Now’ button (see screenshot)”. You can imagine how much faster and easier it is to debug issues with that kind of information at your fingertips. No more jumping blindly between tools – the data you need for root cause analysis is attached to the incident. This level of detail significantly shortens the mean time to repair, because engineers spend less time reproducing issues and more time fixing them.
Built for DevOps: CI Integration and Team Collaboration
Acumen Logs is also designed to slot neatly into a modern DevOps workflow. It offers integrations that developers appreciate, such as a GitHub Actions integration to run synthetic tests as part of your CI/CD pipeline. This means you can automatically execute your critical user journeys on every deployment (or on a schedule) and catch regressions before they hit production. If a journey fails, the GitHub Action can even fail the build or notify the team, acting as an early warning system during your release process. In addition, Acumen supports typical notification channels (email, Slack, etc.) and provides team features like role-based access and shared dashboards. The goal is to make monitoring a seamless part of your development cycle – not an afterthought. In practice, developers can treat important monitoring checks as code (through the no-code builder or APIs) and version them or review them just like any other code change. When an incident occurs, everyone on the team can look at the unified dashboard or share the direct link to a detailed test result. This collaborative, developer-friendly approach ensures that the people who build the system have full visibility and control over monitoring. Instead of a black-box tool that only ops folks touch, Acumen Logs encourages a “monitoring-as-code” mindset that fits DevOps culture.
Fair Pricing and a Fast, Modern UI
Finally, Acumen Logs addresses two often-neglected aspects of tooling: cost and user experience. Many monitoring solutions can rack up hefty bills, especially when you enable advanced features or numerous tests. Acumen has opted for a simple, fair pricing model. For example, uptime monitors start at around $0.85 per month and synthetic journeys at $1.50 per monthmarketplace.whmcs.com. There’s even a free tier to get started. This transparent pricing means you can scale your monitoring without unpleasant surprises on your invoice. It’s monitoring you can justify to the finance team – essentially “affordable pricing” for teams of any sizemarketplace.whmcs.com.
And when it comes to UX, Acumen Logs provides a fast, modern web interface that feels more like a polished SaaS app than an old-school enterprise tool. The dashboard is clean and snappy, with easily customizable views. Setting up a new monitor or test is guided and doesn’t require trawling through pages of settings. In user feedback, teams have noted the “really easy setup process for user journey based synthetic monitoring, and all the reporting options we needed”acumenlogs.com. In short, the tool strives to remove friction at every step – from onboarding to daily use. A pleasant UI/UX might sound secondary, but when you’re in the middle of a firefight with an outage, a responsive interface and clear design can make a world of difference in resolving the issue quickly.
Conclusion: From Headaches to Confidence
Traditional web monitoring left many DevOps teams with a feeling of fighting the tools as much as the incidents. Alert fatigue, missing context, poor UX, and disjointed data were common headaches. With a platform like Acumen Logs, these frustrations are directly addressed by design: fewer, smarter alerts with rich context, an all-in-one dashboard, code-free journey simulations, and developer-centric integrations. The end result is that monitoring becomes an enabler rather than a pain point. Teams can sleep a bit easier knowing their alerts are meaningful and their monitoring covers the real user experience. Instead of dreading the next 3 A.M. false alarm or scrambling through five different tools during an outage, you can have confidence that your monitoring system has your back.
For DevOps teams and developers, adopting a solution that focuses on actionable insights and ease-of-use isn’t just a nice-to-have in 2025 – it’s quickly becoming a necessity. When your monitoring is unified, intelligent, and accessible, you spend less time babysitting the monitoring itself and more time delivering value to users. In a world of ever-more complex web systems, a streamlined approach like this turns monitoring from a source of anxiety into a source of stability.