
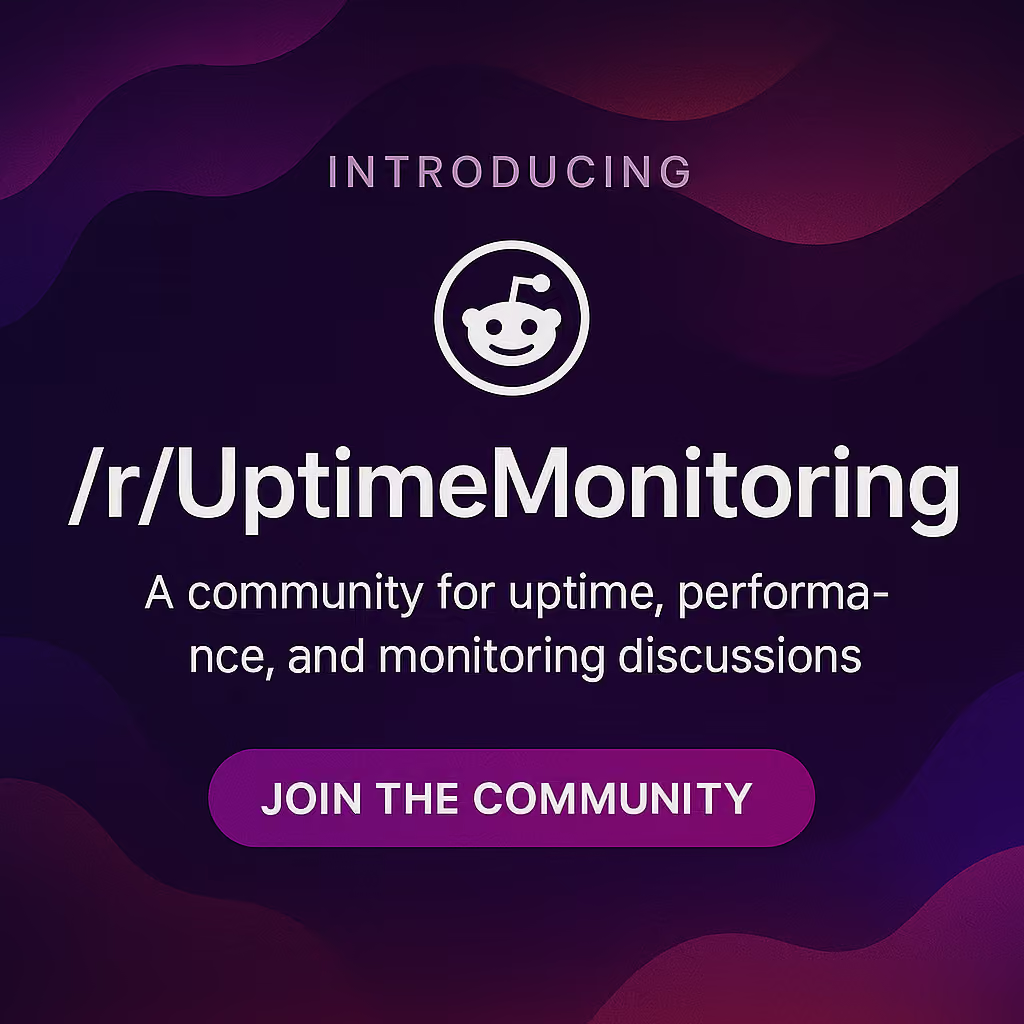
Introducing Our New Reddit Community: /r/UptimeMonitoring
TL;DR
Why /r/UptimeMonitoring?
We created this subreddit for a few key reasons:
- There’s no central place to talk about uptime issues, tools, and tactics.
Monitoring conversations are scattered across forums, support chats, and buried in blog comments. This community brings those discussions into the open. - Tool-agnostic support and learning.
Whether you’re using Acumen Logs, BetterStack, UptimeRobot, or your own Prometheus/Grafana setup — this is a place to learn from others and share what’s working (and what’s not). - Learn from real incidents and strategies.
We’re encouraging post-mortems, architecture breakdowns, alerting strategies, and performance tips. If it helps someone else stay online, it belongs here. - Ask questions and share what you’re building.
Whether you’re troubleshooting a flaky cron job or building out multi-step synthetic journeys, this is a space to get help and give back.
What You’ll Find in the Subreddit
Here’s what we’ll be sharing (and what we’d love to see from you):
- Tips and tutorials on uptime, cron, API, and synthetic monitoring
- Setup walkthroughs for popular stacks (Laravel, Node.js, AdonisJS, WHMCS, etc.)
- Real-world incidents and what we learned from them
- Product updates and open discussions on features
- Troubleshooting help from us and other community members
- Honest takes on tools, alerts, and reliability culture
Join the Conversation
We're just getting started, and we’d love to have you with us from day one. If you're into:
- Monitoring strategy
- Keeping critical systems alive
- Avoiding 3 a.m. alerts
- Performance tuning
- Sharing war stories
Then subscribe to /r/UptimeMonitoring, introduce yourself, and tell us what you're working on.
Not Just for Acumen Logs Users
While we’ll be sharing insights from our own tools (and listening closely to your feedback), this community isn’t just about Acumen Logs — it’s about raising the bar for uptime monitoring across the board.
Whether you’re a solo dev, part of an SRE team, or running infra for a fast-growing startup, we hope this space gives you the support and inspiration to build more reliable systems.
👉 Join /r/UptimeMonitoring Now
Let’s build a stronger monitoring community together.
Key Takeaways
- Joining centralized discussion boards provides engineering teams with a clear space to share real-time platform incident breakdowns.
- Participating in tool-agnostic networks helps you explore alternative alerting workflows and architecture configurations outside your current stack.
- Open collaboration across professional infrastructure groups accelerates how quickly teams resolve complex frontend tracking bugs.
Frequently Asked Questions
Is the /r/UptimeMonitoring subreddit limited only to Acumen Logs users?

%20%E2%80%94%20And%20How%20Is%20It%20Different%20from%20Synthetic%3F.avif)


.avif)