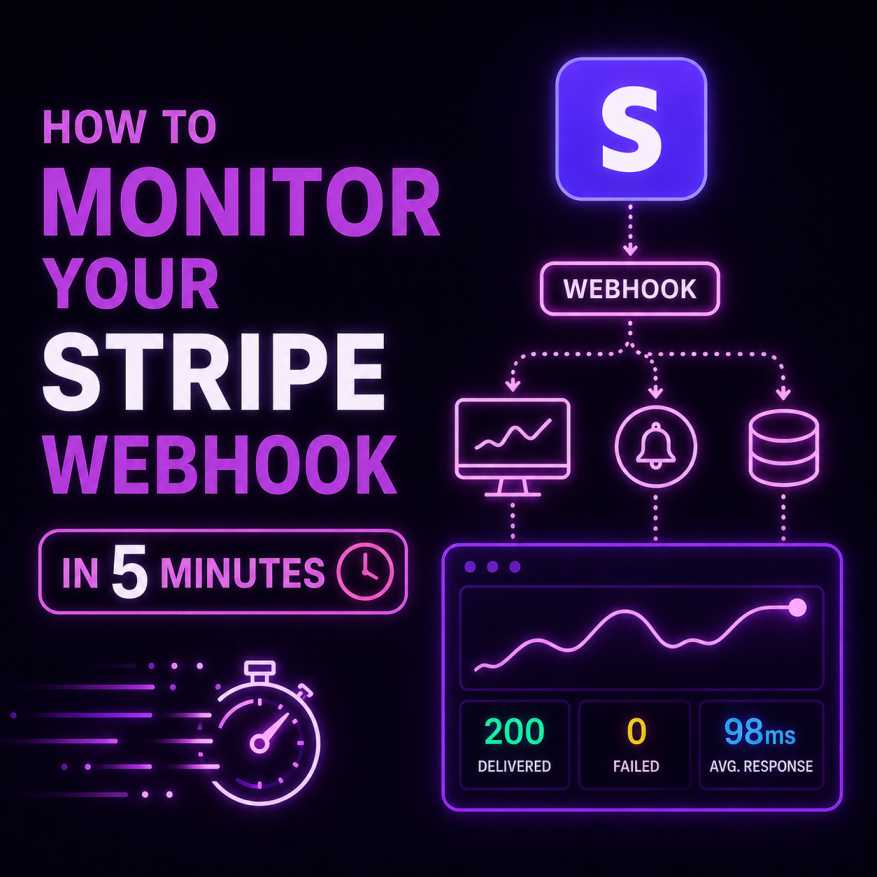
How to Monitor Your Stripe Webhook in 5 Minutes
TL;DR
If your SaaS product uses Stripe, your webhooks are doing a lot of quiet, critical work. They fire when a subscription is created, when a payment fails, when a trial ends. When they work, everything runs smoothly. When they don't — subscriptions don't activate, churned customers don't get offboarded, and your support inbox fills up with confused users.
The worst part? Stripe doesn't always tell you loudly when something's wrong. A webhook can silently fail for hours before anyone notices.
Here's how to set up proper monitoring for your Stripe webhooks using Acumen Logs in under 5 minutes.
Why Stripe Webhook Monitoring Matters
Stripe sends webhook events to an endpoint on your server. If that endpoint:
- Returns a non-2xx status code
- Times out (takes longer than 30 seconds)
- Throws an unhandled exception
- Goes down entirely
...Stripe will retry the event a few times, then stop. You'll have missed events sitting in your Stripe dashboard, and real business logic that never ran.
Common failures we see:
customer.subscription.createdfires but your server is in a deployment window — new user gets no accessinvoice.payment_failedis missed — dunning emails never sendcustomer.subscription.deletedis dropped — cancelled customer retains full access
Step 1: Expose Your Webhook Endpoint
Your Stripe webhook endpoint usually looks something like:
POST https://yourdomain.com/webhooks/stripe
Make sure it's publicly accessible and returns a 200 OK when Stripe hits it with a valid payload.
Step 2: Create an API Monitor in Acumen Logs
Log in to your Acumen Logs dashboard and navigate to API Monitoring. Click Create Monitor and configure it as follows:
- URL: Your Stripe webhook endpoint
- Method: POST
- Headers: Add a
Stripe-Signatureheader if your endpoint validates signatures (use a test signature or a dedicated monitoring key) - Expected status: 200
- Check interval: Every 1 minute
Save the monitor. Acumen Logs will now ping your endpoint continuously and alert you the moment it stops responding correctly.
Step 3: Add a Heartbeat for Background Webhook Processing
If your webhook handler queues jobs (e.g. using Laravel Queues or BullMQ), the API monitor alone won't tell you if the job processor has stalled. Add a heartbeat:
- Go to Heartbeat Monitoring in Acumen Logs
- Create a new heartbeat with a 5-minute expected interval
- Copy the unique pulse URL
- At the end of your webhook job handler, POST to the pulse URL
Now if your job processor stalls or your queue backs up, you'll know within minutes — not when a customer complains.
Step 4: Set Up Slack Alerts
Go to Settings > Alert Channels in Acumen Logs and connect your Slack workspace. Set your API monitor and heartbeat to send alerts to your #incidents or #engineering channel.
You'll get a Slack message the moment your Stripe webhook endpoint goes down or your job processor misses a beat.
Step 5: Test It
Use Stripe's built-in webhook testing to send a test event to your endpoint. Watch the Acumen Logs dashboard update in real time. Then try taking your endpoint offline briefly — you should receive a Slack alert within 60 seconds.
Final Thoughts
Your Stripe webhook endpoint is mission-critical infrastructure. Treat it like one. Five minutes of setup now saves you hours of debugging billing issues later — and protects the trust of every customer who pays you.
Start monitoring your webhooks free at acumenlogs.com.
Key Takeaways
- Webhook drops don't trigger standard server errors because your primary server remains fully powered on even when your payment processing scripts crash.
- Stripe’s default internal retry loop is a great buffer, but it can mask lingering code infrastructure failures until the built-in 72-hour retry window completely expires.
- Continuous payload verification prevents users from getting locked out of your app because it logs database handshake errors the second a payment confirms.