Understanding uptime monitoring
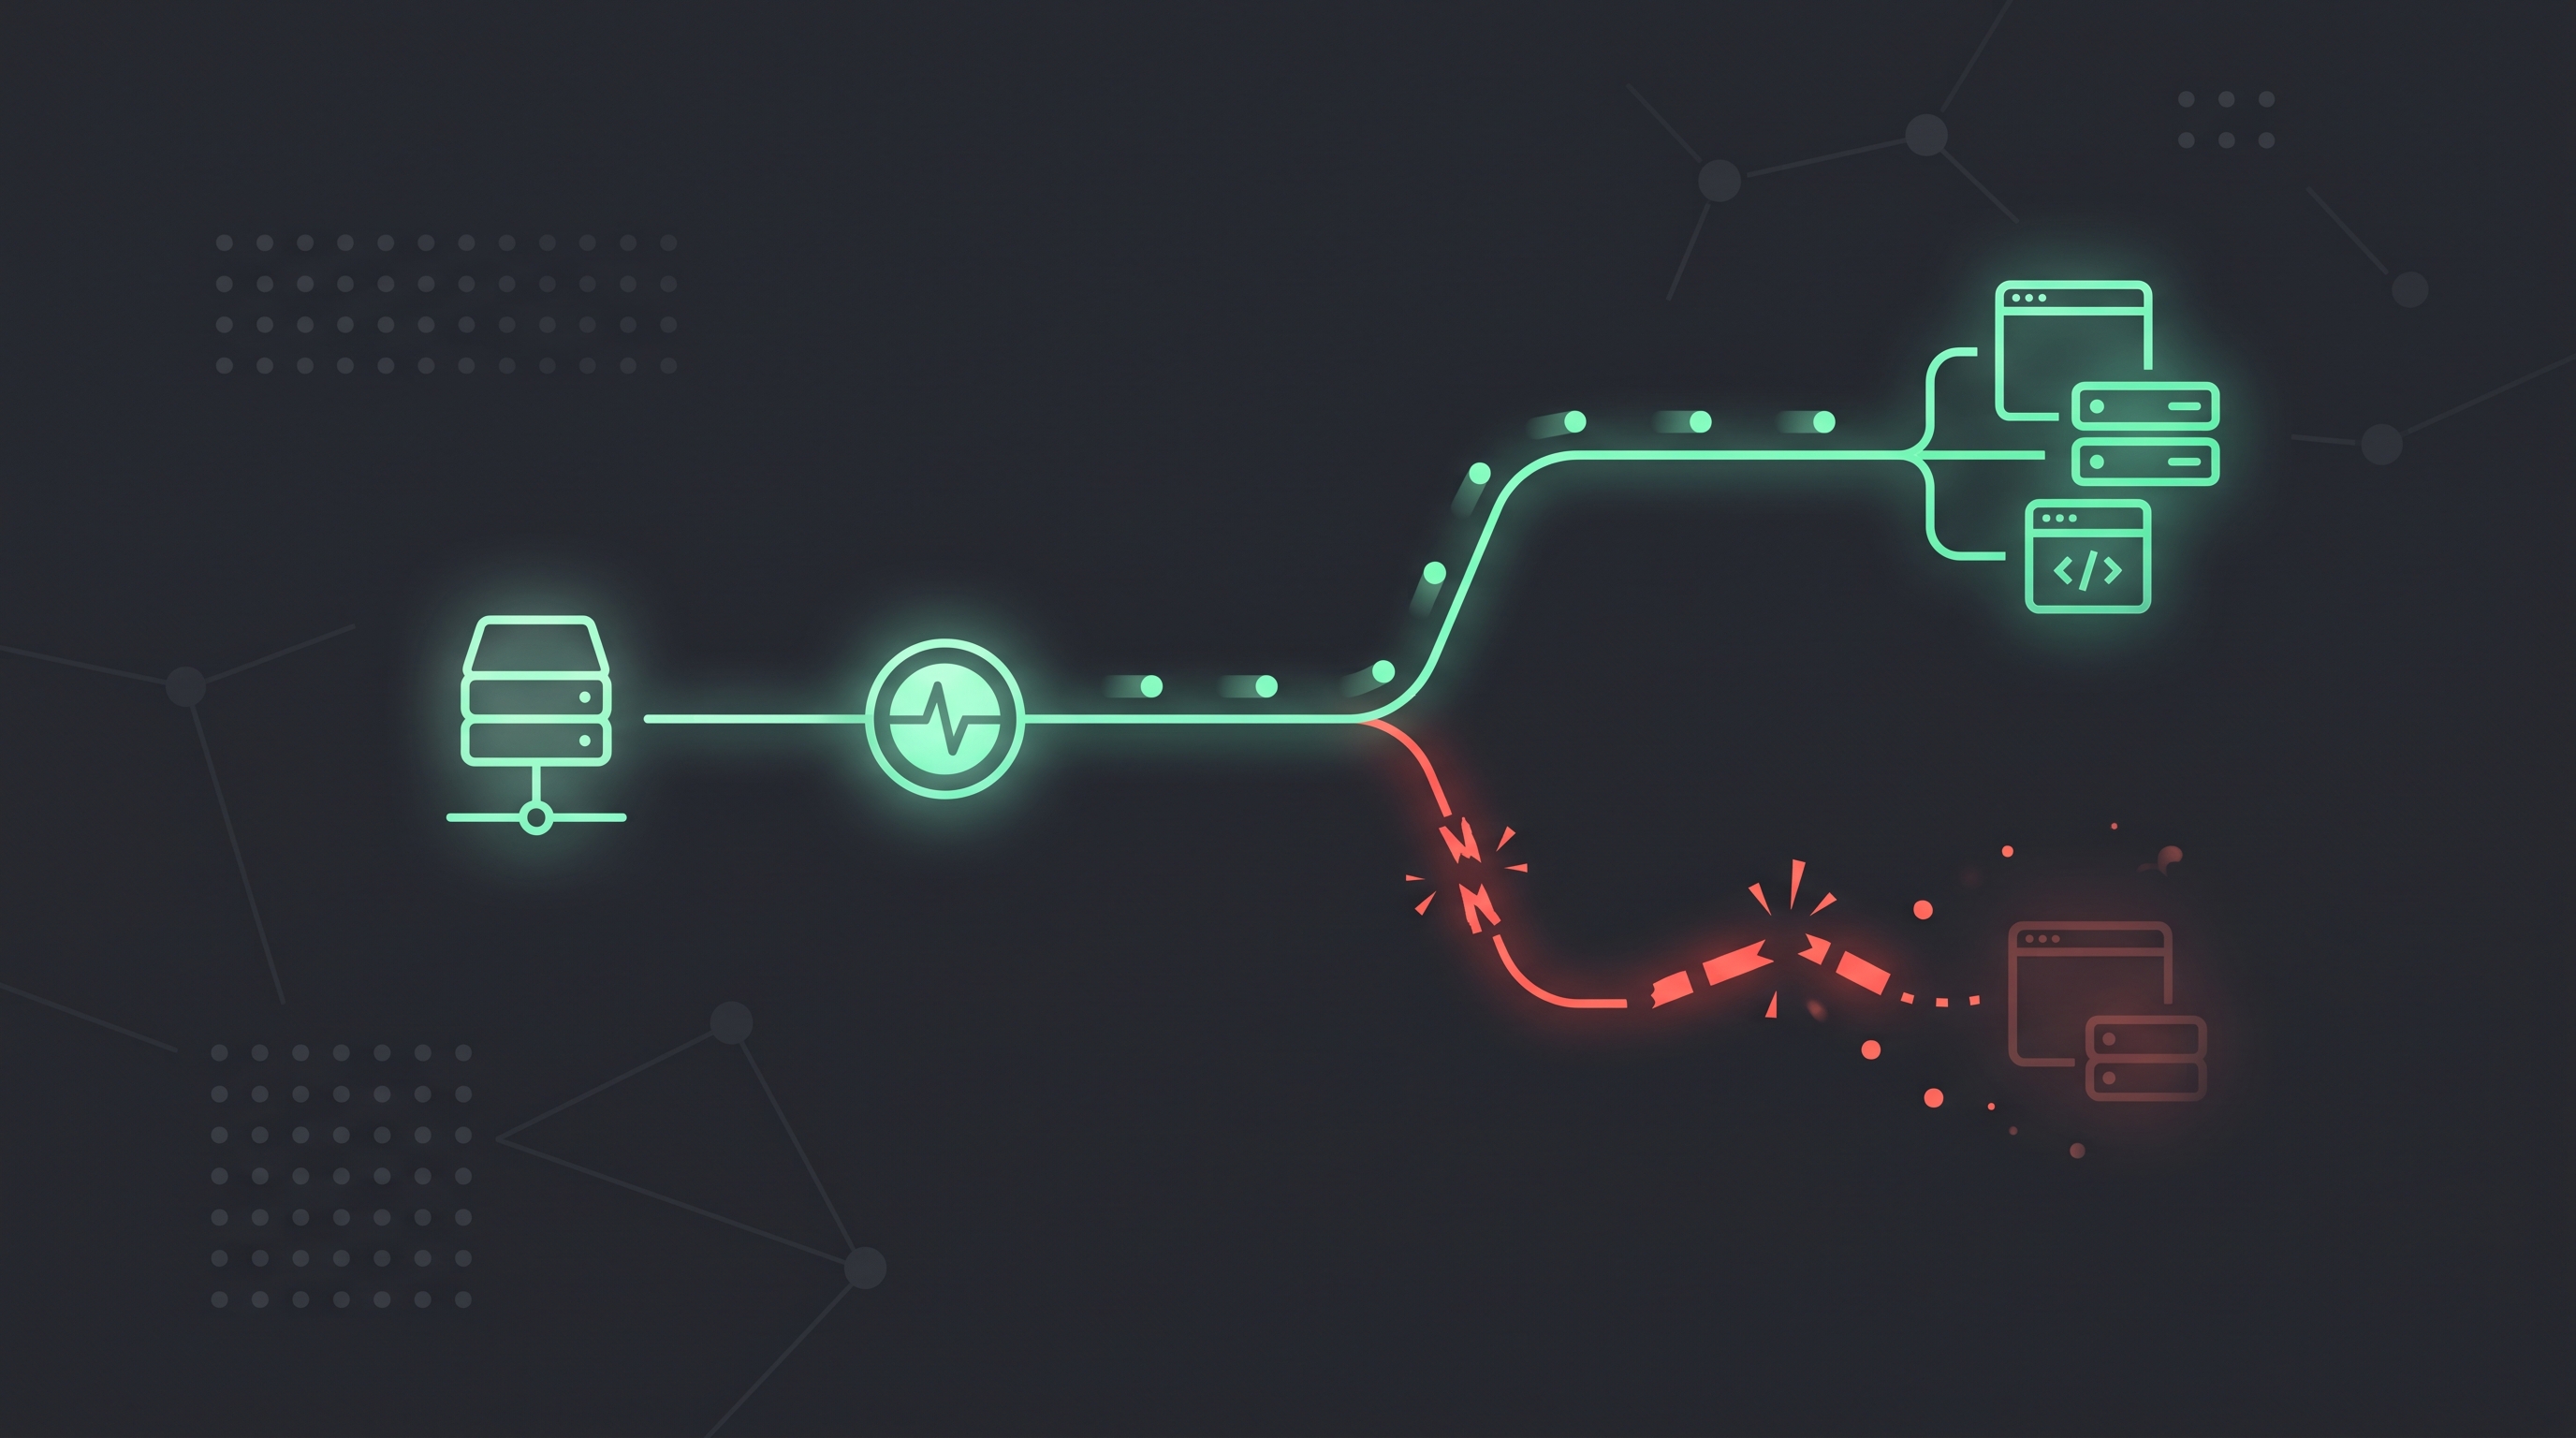
Uptime monitoring tests whether a website, API URL, or other HTTP endpoint is reachable. Acumen Logs runs those checks from multiple regions on an interval you choose: every 1, 5, 10, or 30 minutes (with 5 minutes as the default example). One-minute checks are available from the Solo plan at $5/month. The Free plan includes a shared allowance of 10 monitors (across uptime, API, SSL, WHOIS, RUM, and heartbeat checks) at 10-minute intervals, with 3 days of history and no credit card required.
How a check runs and what counts as a failure
Create an uptime test, name it, and enter the Target URL using a GET or POST request. You choose the status codes that count as healthy (defaulting to 200–299, or adding 301/302 when a redirect is expected). You can also fail a run when latency crosses a millisecond threshold, when the response body is missing a required string, or when it contains an unexpected string. Each run stores the HTTP status code, response time, headers, host IP, and DNS resolve time.
When an alert is sent
Uptime alerts route to email, Slack, Microsoft Teams, desktop notifications, or webhooks (with SMS available from Essentials). Each channel has its own consecutive fail count—we recommend starting email at 2–3 consecutive failures and Slack or Teams at 2. You can use Test Alert to confirm delivery and schedule maintenance windows to mute alerts during planned work.
What this check does not do
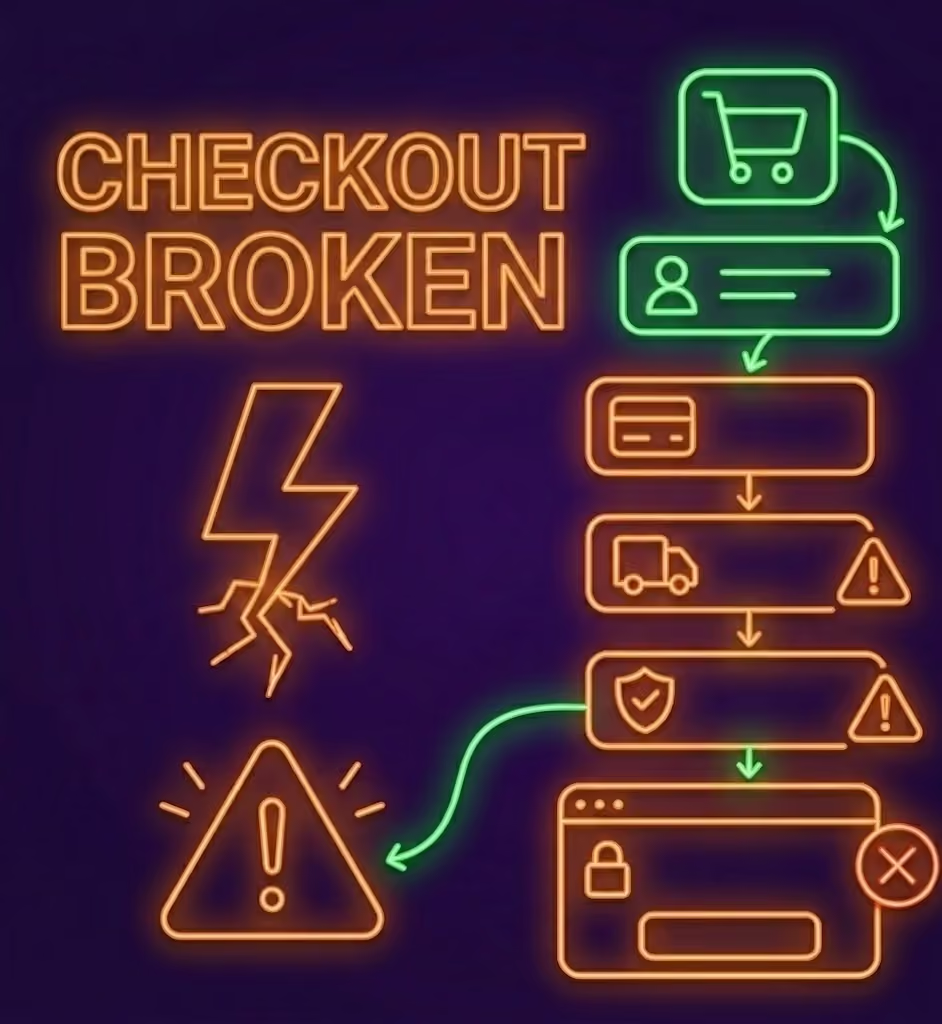
An uptime check confirms the HTTP response. It does not click through a login or checkout (that is synthetic monitoring), watch cron jobs (heartbeat monitoring), or run chained multi-step JSON assertions (API monitoring).


Trusted by Top-tier product companies